Providing you a quick update on what’s been happening in the markets and a few topics we’re keeping an eye on.
Market Activity
Long-term – A lot has changed over the past two years, and a lot has stayed the same. In February of 2021, the S&P 500 closed at 3931 and 23x earnings. Today, roughly two years later, the market multiple has contracted to 17x earnings, but the index level is about the same. Dividends have been a big help over this time frame.
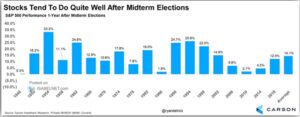
Short-term – Since around mid-October, seasonality factors, the completion of mid-term elections, and stronger and stronger hints of disinflation have helped the market put in a 3-month low. From there we’ve enjoyed a healthy, though bumpy, 10% rebound in the broader market, with decent breadth and momentum. We believe inflation remains the guiding light for the market and more hints of disinflation will serve as support. Due to the lagged effects of Fed interest rate policy, the level of economic damage done remains to be seen.
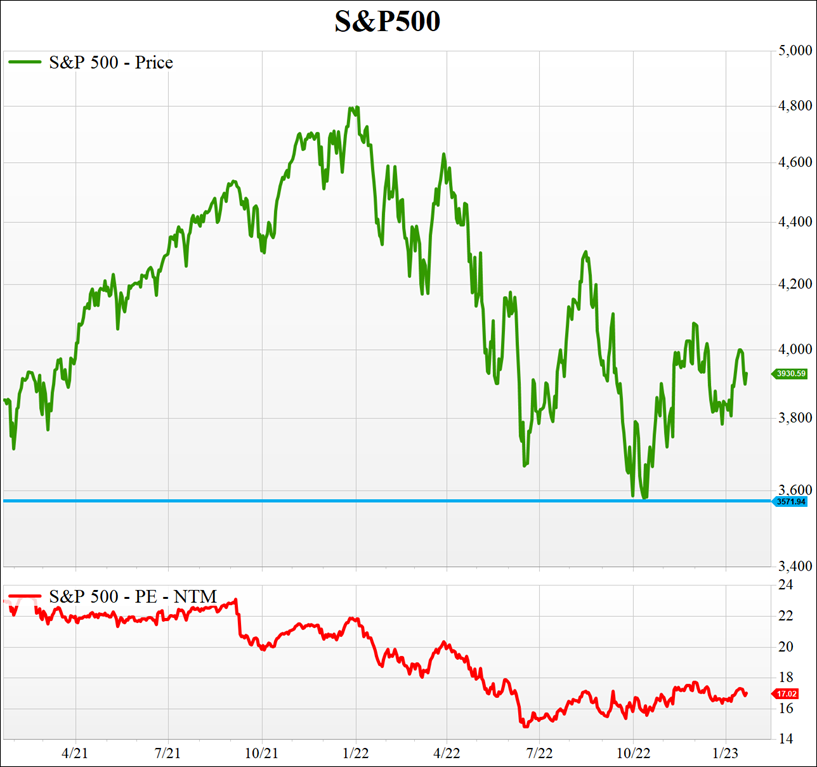
Source: Factset 01/25/23
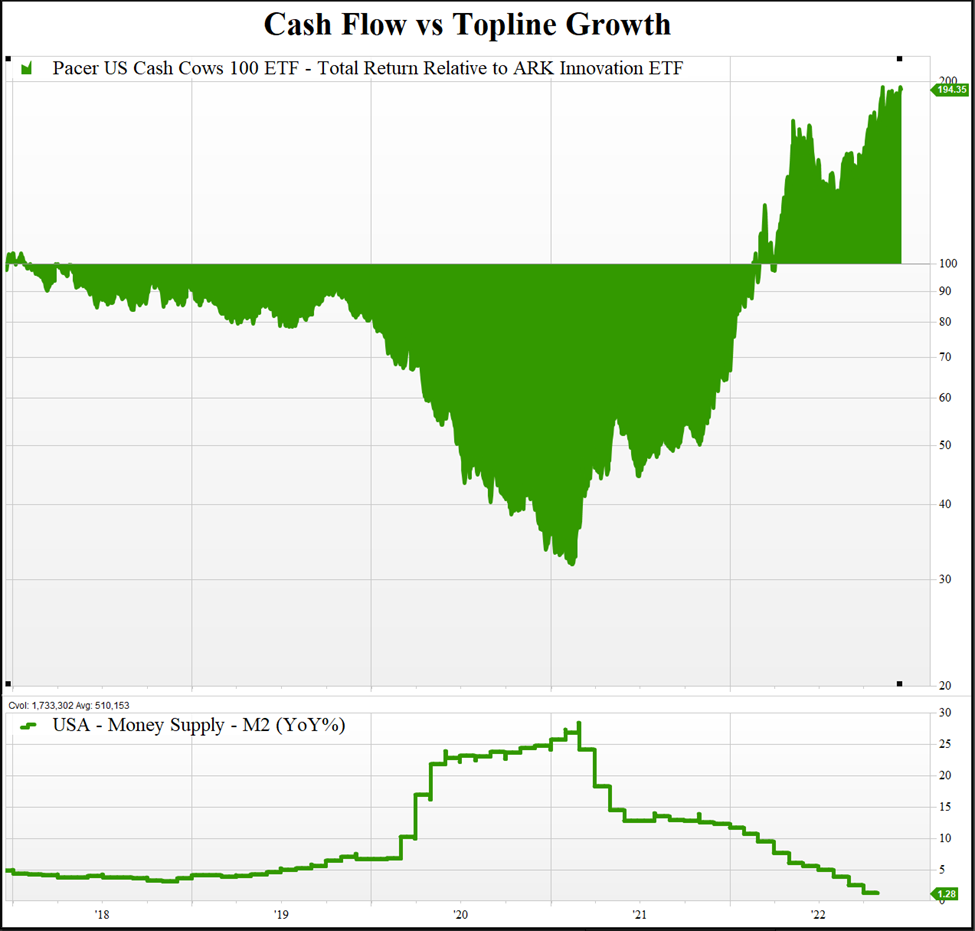
Shorter-term – So far for the month of January, we’ve seen a rebound in growth names as we approached earnings season, and hopes for a Fed pivot have re-asserted themselves. The recent outperformance from the QQQ vs Equal-Weighted S&P climbed up to 5%. Our best guess is that this one-month outperformance in big-cap tech is a bounce and not a major change in trend. We still recommend tilting equity exposures towards companies with strong free cash flows and stable dividends.
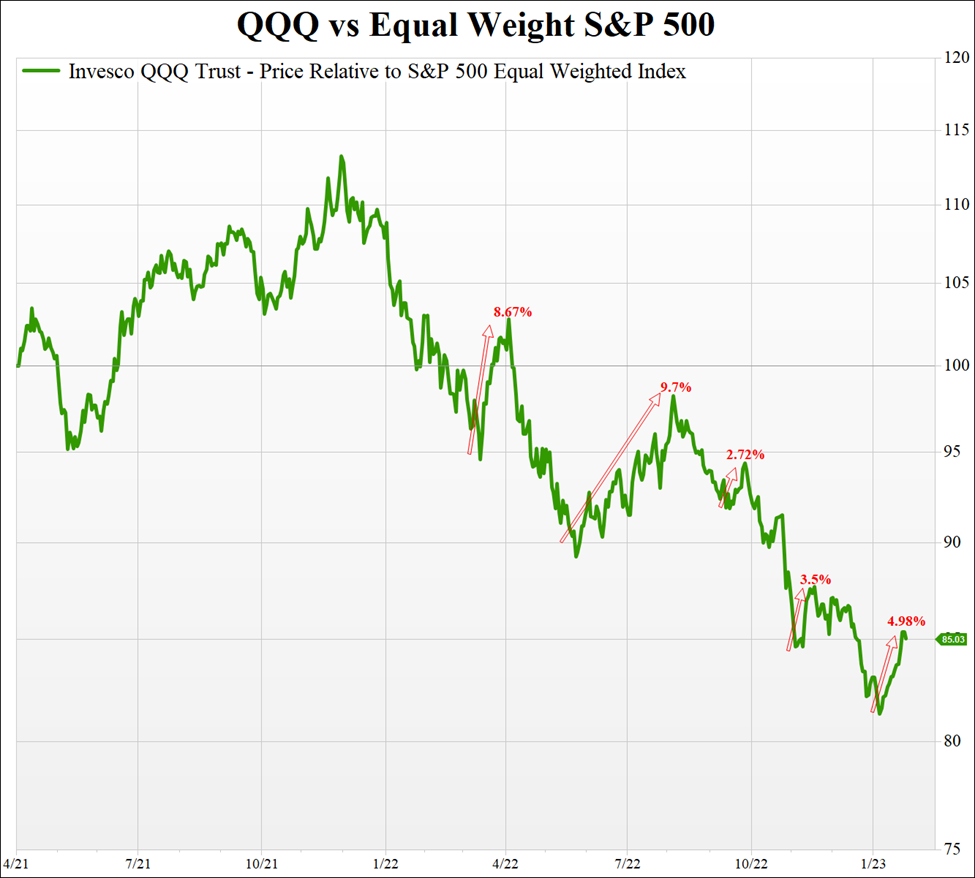
Source: Factset 01/25/23
Valuation
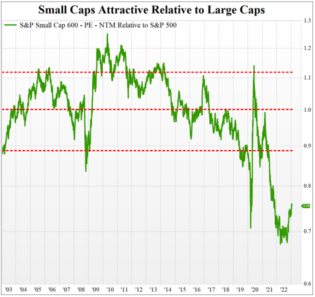
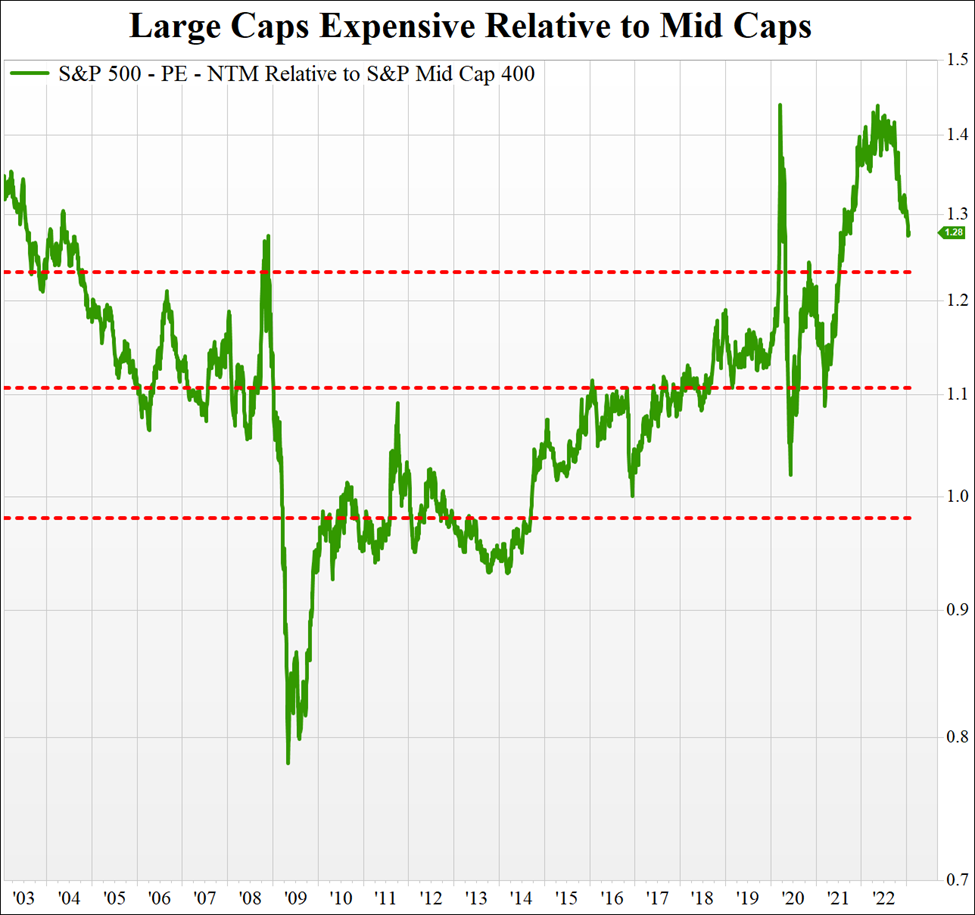
One exercise I find useful at the beginning of a new year is a quick look at valuations across the equity space. As the charts below will show, the value opportunities appear to be in the mid-cap, small-cap, and value-tilted names. Mega-cap growth, while enjoying a reprieve this month, still looks expensive.
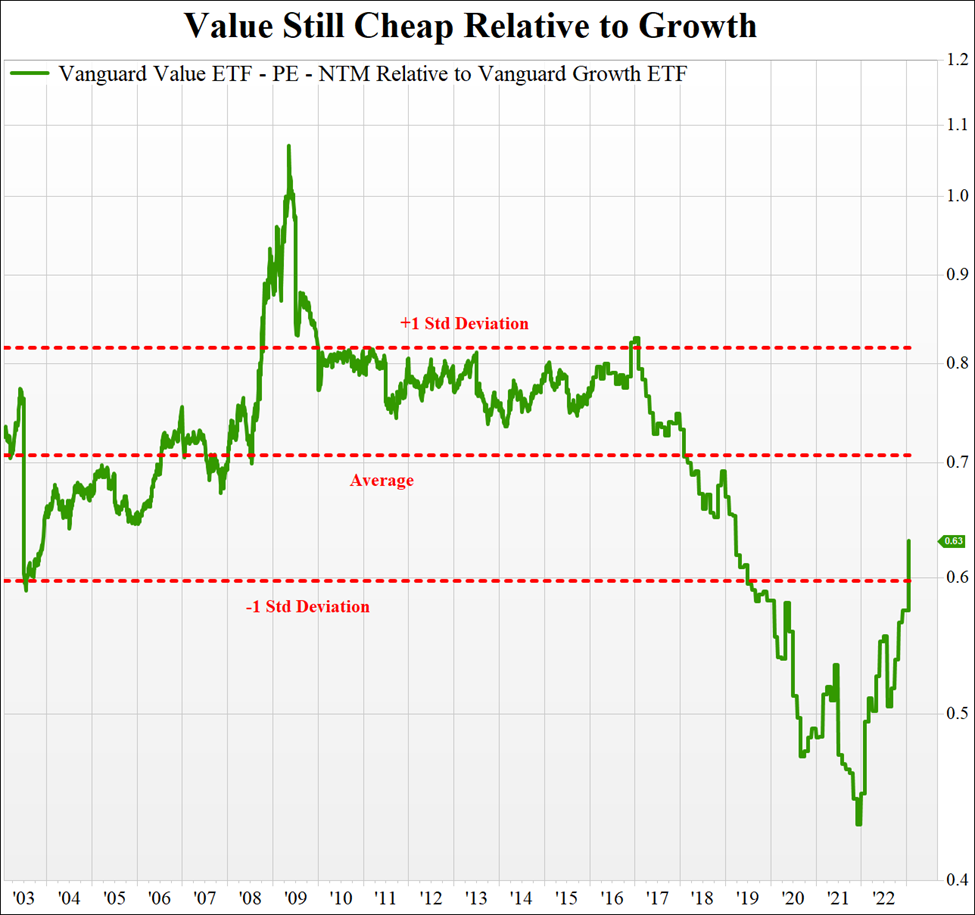
Source: Factset 01/25/23

Source: Factset 01/25/23
Source: Factset 01/25/23
Bond Market and Fed Disconnect
“My 40 plus years of experience in finance strongly recommends that investors should look at what the market says over what the Fed says” – Jeff Gundlach
Fed officials have remained vocal that they expect to raise the Fed Funds rate to 5% and hold it there for longer than the market expects. The market doesn’t believe this and is pricing in cuts around the middle of this year. Recent weak economic data, particularly a contraction in the services sector, and negative month-over-month PPI and CPI readings have been accompanied by treasury yields dropping across the curve.
In predicting the actions of the Fed, one adage always seems to get it right, The Fed Follows the 2-Year.
While we don’t pretend to know exactly what the Fed will do, we do know that the 2-year is 0.3% below the Fed Funds rate and the market usually figures it out first. The only conclusion I can come to is that if the Fed indeed wants to hold rates higher for longer and avoid the stop-and-go mistakes of the 70s – they will need to wind down the rate hikes fairly soon, or prepare for some strong political pressure to cut rates later this year.
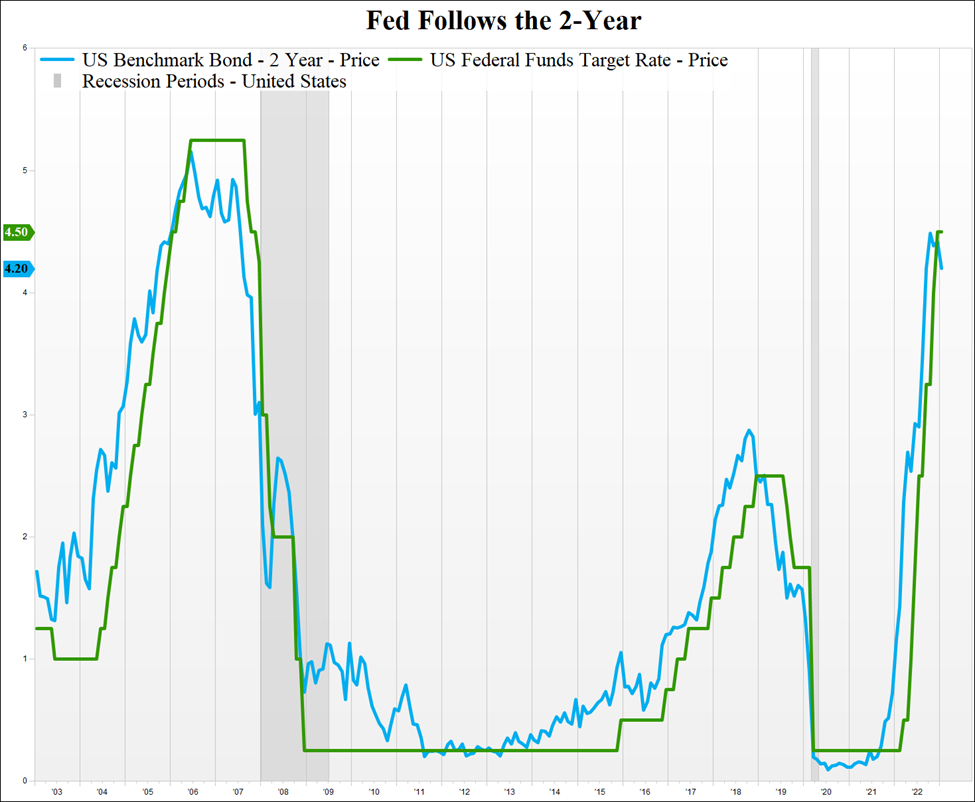
Source: Factset 01/25/23
The Debt Ceiling
Back in early 2021, the US budget deficit hit $4 trillion in the aftermath of Covid aid. One year later, the deficit fell to $3 trillion – the largest fiscal tightening since the late 1940s, post WWII. Since then, the deficit is reversing higher again due to increased interest costs. If you’ve been watching the news lately, you’ve probably heard some discussion about the looming debt ceiling fight in Washington. With the statutory debt limit of $31.4 trillion being bumped last week, Treasury head Janet Yellen is implementing “extraordinary measures” to keep the government afloat through the Spring.
“While Treasury is not currently able to provide an estimate of how long extraordinary measures will enable us to continue to pay the government’s obligations, it is unlikely that cash and extraordinary measures will be exhausted before early June” – Janet Yellen
June and July are set up to be very active in terms of legislative action. Republicans are pushing for discretionary spending cuts to cooperate on raising the debt ceiling and will need to pick where to specifically cut, unify around those cuts, and get that message out to the public soon. Should an agreement to raise the debt ceiling not be reached by this summer, House Republicans will likely try to pass a bill prioritizing interest payments as well as Social Security, Medicare, and defense. This will be a defensive measure to protect Republicans should the debate devolve and linger well past the Treasury’s exhaustion. That’s about all we can predict at this point. It’s possible an agreement is reached earlier, and a repeat of the 2011 debt ceiling fiasco is avoided, but we’d bet on some fiscal fireworks this summer.
That said, we don’t think potential fiscal noise is any reason to deviate from an investment strategy, it will come and go. On August 5th, 2011, S&P downgraded US debt following congressional fighting over the debt ceiling – the market fell heading into that downgrade but quickly recovered and carved out a fresh high within the next year. We would view any potential market volatility during this summer, caused by fiscal woes, to be looked at as a buying opportunity.
Have a great week,
Adam